
In this article, we will study the global price of cotton in the months before the outbreak of the Corona virus, the months of the peak of the outbreak and the months of the decrease in the incidence of this virus and the gradual opening of factories.
Note the following table:
Investigating the effect of Coronavirus (covid-19) on the Global Cotton Price
| Date | price | Rate of change |
|---|---|---|
| Jun 2019 | 1/71 | |
| Jul 2019 | 1/67 | % 2/34 - |
| Aug 2019 | 1/56 | % 6/59 - |
| Sep 2019 | 1/57 | % 0/64 |
| Oct 2019 | 1/63 | % 3/82 |
| Nov 2019 | 1/65 | % 1/23 |
| Dec 2019 | 1/67 | % 1/21 |
| Jan 2020 | 1/74 | % 4/19 |
| Feb 2020 | 1/69 | % 2/87 - |
| Mar 2020 | 1/49 | % 11/83 - |
| Apr 2020 | 1/40 | % 6/04 - |
| May 2020 | 1/45 | % 3/57 |
This table shows the price in terms of dollars and the percentage change in the price of cotton fibers from June 2019 to May 2020. According to this table, the price of cotton has always been fluctuating, but since February 2020, the price reduction has started and the highest decrease in the price of cotton was in March 2020, and the price reduction has continued for April.
In May 2020, cotton prices increased due to the gradual opening of factories and the start of various industries. For a closer look at this issue, see the chart below:
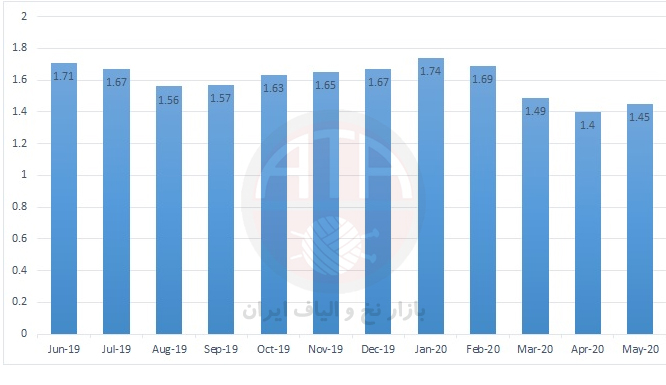
As can be seen in the chart, March and April, the peak of the corona, saw the largest price decline.